// NOTE //
The header above is the page title. It DOES NOT appear on the page, but is necessary for the file system of the site and for the menu. The header below this note does appear.
If there are two identical headers below: They display on screens of different sizes. The first one displays ONLY on screens with a width of 600px or more. The second one displays ONLY on screens with a width of 600px or less. It can be used to create manual line breaks to avoid the automatic line breaks the website would otherwise make. Don’t delete them or no header will appear!
(This note itself is set to Display:None so it will not show up when viewing the live page.)
//END NOTE//
2023 Common App Research
2023 Common App Research
Common App gave Genny Beemyn exclusive access to review de-identified data on the more than one million students who filled out the application for Fall 2023 college admission. Genny examined the students’ gender identities and pronouns, along with intersections with legal sex, race, first-generation status, citizenship status, U.S. armed forces status, state of residence, parents’ marital status, whether they have any children of their own, cumulative GPA, and type of high school attended. This ongoing research project has yielded the largest body of data on the gender identities and pronouns of incoming college students that has ever been available. Some of the findings are presented below. (For 2022 findings, view 2022 Common App Research.)
Genny’s Common App 2023 research findings on this page may be quoted with appropriate attribution in educational settings and wherever fair use may apply. [Learn more about what constitutes “fair use.”]
Compilation and Analysis of the Gender and Pronoun Data from the Common App for Students Who Applied for Fall 2023 Admission
(n = 1,178,651)
- Gender Identity
- Gender Identity and Legal Sex
- Gender Identity and Intersections with Other Demographic Data
- Pronouns
NOTE: Some tables may be wider than the screen used to view them. Use the scroll bar at the bottom of these tables to view all columns.
Gender Identity
Gender Indicated by the Common App Students
(n = 1,178,651)
For the 2021-2022 college admissions cycle, the Common App added optional questions on gender and pronouns for the students applying to college. These same questions were used for the 2022-2023 admissions cycle. For the gender question, students could choose female, male, nonbinary, or “another gender,” with a fill-in box to indicate their gender. For the pronoun question, the choices were he/him, she/her, they/them, and “another set of pronouns,” with a fill-in box to indicate their pronouns. Students could choose more than one option for each question.
| Gender | Number (n) | Percentage in 2023 (%) | Percentage in 2022 (%) |
|---|---|---|---|
| Female | 633,980 | 53.79% | 52.92% |
| Male | 504,100 | 42.77% | 42.80% |
| Nonbinary | 16,175 | 1.37% | 1.07% |
| “Another gender”* | 2,771 | 0.24% | 0.20% |
| More than one response* | 7,464 | 0.63% | 0.58% |
| No data | 14,120 | 1.20% | 2.43% |
| Unclear or inappropriate responses | 41 |
* These figures recode students who marked the “another gender” option and who indicated that they were female/male, provided an unclear or inappropriate response, or chose not to provide a response.
Gender Identity: (Presumably) Cisgender* vs. Trans and Nonbinary Students
(n = 1,178,610)*
| Gender | Number (n) | Percentage in 2023 (%) | Percentage in 2022 (%) |
|---|---|---|---|
| Total presumably cisgender | 1,132,853 | 96.12% | 95.41% |
| Presumably cis women# | 632,346 | 53.65% | 52.80% |
| Presumably cis men# | 500,507 | 42.47% | 42.60% |
| Trans or nonbinary | 31,637 | 2.68% | 2.15% |
| No data or preferred not to say | 14,120 | 1.20% | 2.43% |
* These figures do not include 41 unclear or inappropriate responses.
# “Presumably cis women” students were individuals who indicated their legal sex as female and their gender identity as female, and “presumably cis men” students were individuals who indicated their legal sex as male and their gender identity as male. The total of presumably cisgender students reflects the combined total of these two identity groups. These numbers are likely inflated because some trans and nonbinary students may have indicated that they were cis, rather than come out on the Common App, and some trans women and men students may have changed their legal sex to match their gender identity prior to completing the Common App.
Three Categories: Trans Men, Trans Women, and Nonbinary Students
(n = 1,178,610)
| Gender | Number (n) | Percentage in 2023 (%) | Percentage in 2022 (%) |
|---|---|---|---|
| Trans men* | 3,806 | 0.323% | 0.227% |
| Trans women* | 1,703 | 0.144% | 0.128% |
| Nonbinary individuals# | 25,959 | 2.203% | 1.783% |
| Trans, but uncategorizable | 169 | 0.014% | 0.016% |
| Total | 31,637 | 2.68% | 2.15% |
* Trans men students were individuals who indicated their legal sex as female and their gender identity as male or who wrote in that they were trans male/men, and trans women students were individuals who indicated their legal sex as male and their gender identity as female or who wrote in that they were trans female/women.
# Nonbinary students were individuals who indicated one or more nonbinary identities (e.g., genderfluid, genderqueer, agender, bigender, pangender, demigirl, demiboy, transmasculine, transfeminine, gender nonconforming), even if they also indicated a male/man or female/woman identity.
Trans Men, Trans Women, and Nonbinary Students
(n = 31,468*)
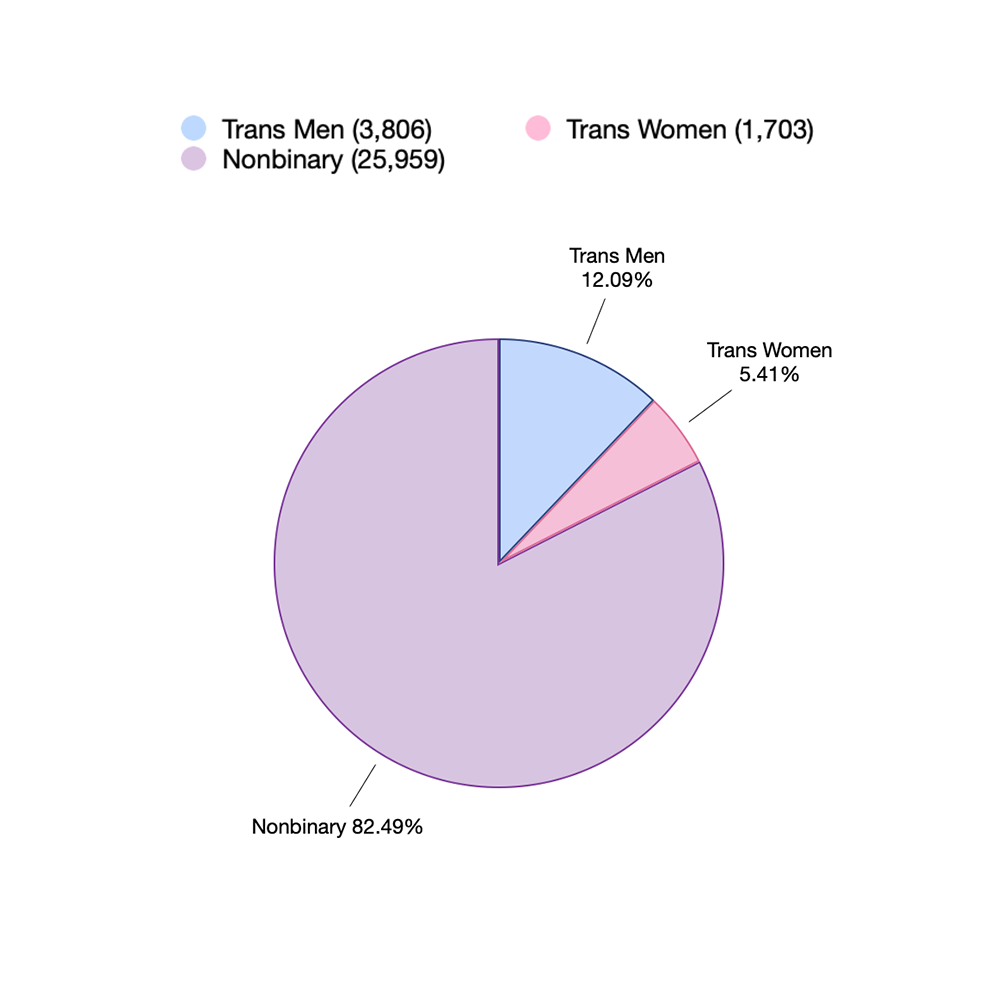
*This figure does not include students who did not specify how they identified as trans.
Four Categories: Trans Men, Trans Women, Nonbinary, and Nonbinary Women/Men Students
(n = 1,178,610)
| Identity | Number (n) | Percentage (%) |
|---|---|---|
| Trans men* | 3,806 | 0.323% |
| Trans women* | 1,703 | 0.144% |
| Nonbinary individuals# | 19,677 | 1.670% |
| Nonbinary women/men@ | 6,282 | 0.533% |
| Non-specific trans identities | 169 | 0.014% |
| Total | 31,641 | 2.68% |
* Trans men students were individuals who indicated their legal sex as female and their gender identity as male or who wrote in that they were trans male/men, and trans women students were individuals who indicated their legal sex as male and their gender identity as female or who wrote in that they were trans female/women.
# Nonbinary students were individuals who indicated a nonbinary identity or identities (e.g., genderfluid, genderqueer, agender, bigender, pangender, demigirl, demiboy, transmasculine, transfeminine, gender nonconforming) or both male/man and female/woman.
@ Nonbinary women/men students were individuals who indicated one or more nonbinary identities and a female/woman or male/man identity (e.g., genderqueer female, agender woman, nonbinary male, girlflux).
Trans Men, Trans Women, Nonbinary, and Nonbinary Woman/Man Students
(n = 31,468*)
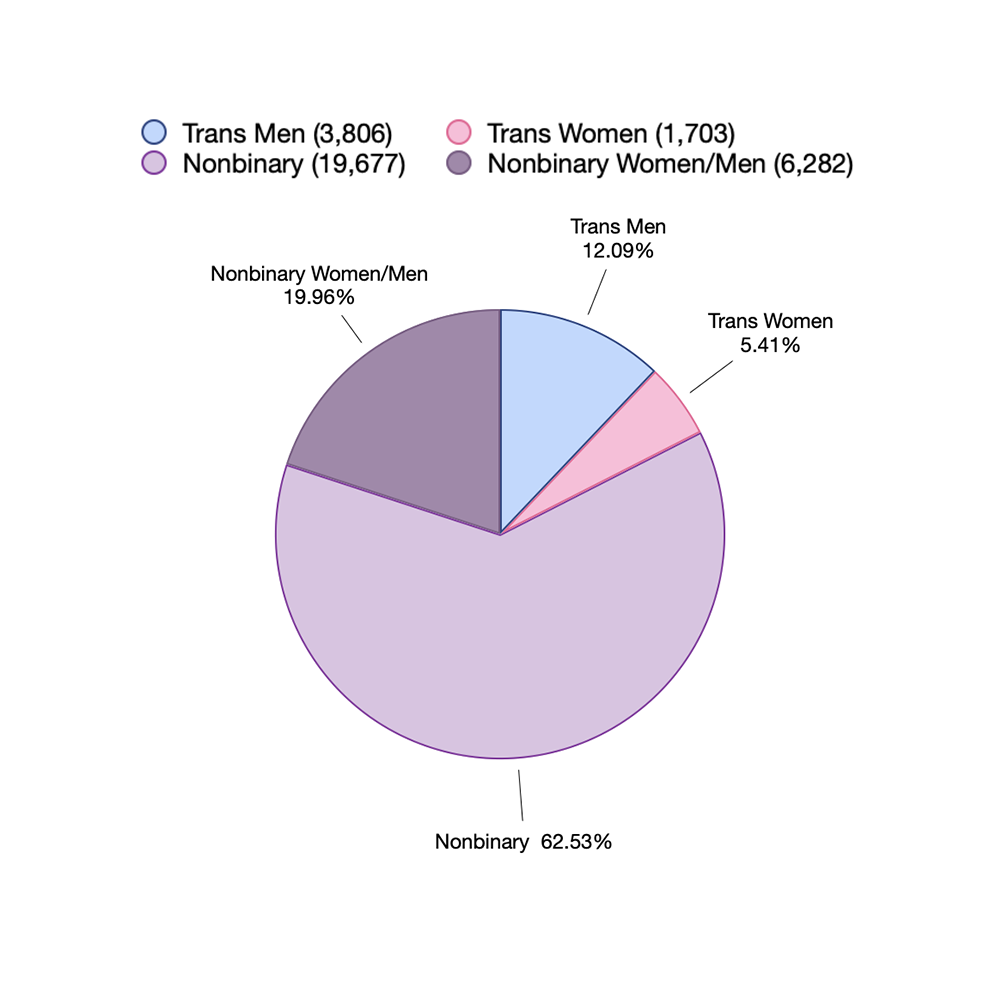
*This figure does not include students who did not specify how they identified as trans.
“Add Another Gender” Responses
- 3,775 students wrote in a trans or nonbinary gender identity, either as “another gender” only or “another gender” in combination with one or more of the provided gender choices.
- These students provided more than 100 unique responses, among them: ambigender, anarchogender, anvis, apagender, cassgender, female adjacent, gender apathetic, genderfae, genderfaun, gendervoid, girlflux, greygender, libragender, maverique, multigender, neutrois, omnigender, pangender, paragirl, polygender, pomogender, two spirit, and xenogender.
- The most common trans and nonbinary gender identities, as compared to 2022*:
| Identity | 2023 (n = 3,775) | Percentage (%) | 2022 (n = 3,521) | Percentage (%) |
|---|---|---|---|---|
| genderfluid | 1,671 | 44.26% | 1,462 | 41.52% |
| genderqueer | 430 | 11.39% | 344 | 9.77% |
| agender | 384 | 10.17% | 296 | 8.41% |
| trans man/male | 217 | 5.75% | 315 | 8.95% |
| demigirl | 168 | 4.45% | 180 | 5.11% |
| questioning | 115 | 3.05% | 124 | 3.52% |
| demiboy | 80 | 2.12% | 49 | 1.39% |
| trans masculine | 80 | 2.12% | 71 | 2.02% |
| gender nonconforming | 80 | 2.12% | 72 | 2.04% |
| bigender | 79 | 2.09% | 38 | 1.08% |
| trans woman/female | 72 | 1.91% | 89 | 2.53% |
| unlabeled | 65 | 1.72% | 39 | 1.11% |
* To view the 2022 trans and nonbinary identities in order of popularity or to see related details from 2022, please see the 2022 Common App Research page.
Gender Identity and Legal Sex
Nonbinary individuals who are legally female (and presumably were assigned female at birth) far outnumber nonbinary individuals who are legally male, and there are more than twice the percent of self-identified trans men as trans women. This is likely due to the fact that it remains very difficult for someone expected to be male to present in any way that is considered feminine.
NOTE: Students could only indicate “female” or “male” as their legal sex on the Common App during the 2022-23 admissions cycle. Beginning with the 2023-24 admissions cycle, the Common App added a third option: “X or another legal sex.”
Legal Sex of All Students in the Sample
(n = 1,178,651)
| Legal sex | Number (n) | Percentage (%) |
|---|---|---|
| Legally female | 663,914 | 56.33% |
| Legally male | 514,737 | 43.67% |
Legal Sex of Presumably Cis Students* (n = 1,132,853)
| Legal sex | Number (n) | Percentage (%) |
|---|---|---|
| Legally female | 632,346 | 55.82% |
| Legally male | 500,507 | 44.18% |
* Presumably cis students were individuals who indicated that their legal sex and gender identity were both male or both female. The total of presumably cisgender students reflects the combined total of these two identity groups. These numbers are likely inflated because some trans and nonbinary students may have indicated that they were cis, rather than come out on the Common App, and some trans women and men students may have changed their legal sex to match their gender identity prior to completing the Common App
Legal Sex of Female-Identified Students
(n = 634,049)
| Legal sex | Number (n) | Percentage (%) |
|---|---|---|
| Legally female | 632,346 | 99.73% |
| Legally male (i.e., trans women) | 1,703 | 0.27% |
2022 data – Legally female: 99.78%, Trans women (legally male): 0.22%
Legal Sex of Male-Identified Students
(n = 504,313)
| Legal sex | Number (n) | Percentage (%) |
|---|---|---|
| Legally female (i.e., trans men) | 3,806 | 0.75% |
| Legally male | 500,507 | 99.25% |
2022 data – Trans men (legally female): 0.46%, Legally male: 99.54%
Legal Sex of Nonbinary Students
(n = 19,677)
| Legal sex | Number (n) | Percentage (%) |
|---|---|---|
| Legally female | 15,611 | 79.34% |
| Legally male | 4,066 | 20.66% |
2022 data – Legally female: 80.47%, Legally male: 19.53%
Legal Sex of Nonbinary Woman/Man* Students
(n = 6,282)
| Legal sex | Number (n) | Percentage (%) |
|---|---|---|
| Legally female | 4,861 | 77.38% |
| Legally male | 1,421 | 22.62% |
2022 data – not calculated
* Nonbinary woman/man students were individuals who indicated one or more nonbinary identities and a female/woman or male/man identity (e.g., genderqueer female, agender woman, nonbinary male, girlflux).
Gender Intersections with Other Demographic Data
Gender and Race
Percent of Each Racial Group Identifying as Trans or Nonbinary
Students who indicated their race as two or more races, Latinx, and white identified as trans or nonbinary at higher rates than students overall, whereas Black/African American and Asian students identified at lower rates (American Indian/Alaska Native and Native Hawaiian or Other Pacific Islander students involved small sample sizes). International* students identified as trans or nonbinary at a much lower rate than students overall. These results are similar to the 2022 findings.
| Racial Identity | 2023 | 2022 |
|---|---|---|
| Two or more races | 4.05% | 3.25% |
| American Indian or Alaska Native | 2.85% | 3.00% |
| Latinx | 2.79% | 2.53% |
| Asian | 1.94% | 1.56% |
| Black or African American | 1.91% | 1.76% |
| Native Hawaiian or Other Pacific Islander | 1.64% | 2.15% |
| People of Color total | 2.49% | 2.18% |
| White | 2.95% | 2.42% |
| International* | 1.23% | 1.04% |
| Overall | 2.68% | 2.15% |
* The Common App includes international students residing in the U.S., whom they refer to as “nonresident aliens,” as a separate race/ethnicity, even though these students may identify as other races/ethnicities.
Race by Gender Identity
The trans students, especially the trans women and trans men students, were more likely to be white and less likely to be Black/African American and Asian than the presumably cis women and men students. The international students were less likely to identify as trans women, trans men, and nonbinary individuals than as cis women and cis men.
| Racial group | Presumably cis women | Presumably cis men | Trans women | Trans men | Nonbinary | Nonbinary women/men |
|---|---|---|---|---|---|---|
| White | 48.35% | 50.93% | 61.77% | 60.06% | 53.68% | 49.86% |
| Latinx | 19.62% | 17.08% | 15.27% | 17.21% | 19.76% | 19.55% |
| Black or African American | 14.14% | 12.40% | 9.22% | 7.57% | 9.44% | 10.46% |
| Asian | 9.69% | 11.08% | 5.58% | 5.62% | 7.43% | 8.61% |
| Two or more races | 5.15% | 4.84% | 5.99% | 7.33% | 7.33% | 9.18% |
| American Indian or Alaska Native | 0.28% | 0.27% | 0.23% | 0.32% | 0.27% | 0.35% |
| Native Hawaiian or Other Pacific Islander | 0.15% | 0.14% | 0.18% | 0.05% | 0.08% | 0.13% |
| International* | 0.86% | 1.09% | 0.41% | 0.37% | 0.45% | 0.40% |
* The Common App includes international students residing in the U.S., whom they refer to as “nonresident aliens,” as a separate race/ethnicity, even though these students may identify as other races/ethnicities.
U.S. Citizenship Status
Again, international students (“citizen of a non-U.S. country”) are less likely to identify as trans women and men and nonbinary students than as presumably cis women and men students. DACA/undocumented students and refugee/asylee students were somewhat less likely to identify as trans as well. These differences seemingly reflect the difficulties of trans and nonbinary students getting to the U.S. and, for those who do, in being part of U.S. LGBTQ+ communities and in being out among students from their home countries.
| Citizenship Status | Presumably Cis Women | Presumably Cis Men | Trans Women | Trans Men | Nonbinary | Nonbinary Women/Men |
|---|---|---|---|---|---|---|
| U.S. Citizen | 93.17% | 92.76% | 93.66% | 95.35% | 94.38% | 93.79% |
| U.S. Dual Citizen | 3.09% | 3.44% | 3.88% | 2.81% | 3.86% | 4.19% |
| U.S. Permanent Resident | 2.15% | 2.10% | 1.56% | 1.05% | 0.98% | 1.37% |
| DACA/ Undocumented | 0.47% | 0.35% | 0.23% | 0.26% | 0.24% | 0.16% |
| U.S. Refugee/ Asylee | 0.25% | 0.26% | 0.23% | 0.16% | 0.08% | 0.10% |
| Citizen of non-U.S. Country | 0.86% | 1.09% | 0.41% | 0.37% | 0.45% | 0.40% |
Pre-College Experience
Military Status
Relatively few students have served or currently serve in the military. Not surprisingly, cis men are more likely to be in the military today than other groups. But 43 trans students are currently in the military, and trans women and men and nonbinary students are more likely than presumably cis women and men to be dependents of someone who serves or has served in the military.
| Military status | Presumably Cis Women | Presumably Cis Men | Trans Women | Trans Men | Nonbinary | Nonbinary Women/Men |
|---|---|---|---|---|---|---|
| Currently serving | 0.11% | 0.37% | 0.18% | 0.11% | 0.13% | 0.18% |
| Previously served | 0.04% | 0.15% | 0.18% | 0.05% | 0.06% | 0.05% |
| Dependent | 1.52% | 1.40% | 1.94% | 2.15% | 2.17% | 2.01% |
| None | 98.33% | 98.08% | 97.71% | 97.69% | 97.64% | 97.77% |
High School Type
Trans women and men and nonbinary students are much more likely to have been home schooled than presumably cis women and men students, which may be in response to school harassment, and much less likely to have attended a religiously affiliated high school, which tend to be more anti-trans than other types of schools.
| School type | Presumably Cis Women | Presumably Cis Men | Trans Women | Trans Men | Nonbinary | Nonbinary Women/Men |
|---|---|---|---|---|---|---|
| Public | 80.74% | 77.42% | 81.91% | 83.03% | 82.05% | 82.51% |
| Religious | 9.20% | 11.59% | 4.17% | 4.10% | 4.88% | 5.14% |
| Independent | 5.10% | 6.39% | 6.46% | 5.81% | 6.65% | 6.59% |
| Charter | 4.04% | 3.82% | 6.05% | 5.57% | 5.11% | 4.78% |
| Home Schooled | 0.58% | 0.51% | 1.00% | 0.89% | 0.84% | 0.60% |
Family Background
Gender Identities of Common App Students by First-Generation* Status
| First-Gen Status | Total | Presumably Cis Women | Presumably Cis Men | Trans Women | Trans Men | Nonbinary | Nonbinary Women/Men |
|---|---|---|---|---|---|---|---|
| First-Gen | 35.97% | 39.24% | 32.07% | 31.59% | 38.94% | 36.10% | 34.51% |
| Not First-Gen | 64.03% | 60.76% | 67.93% | 68.41% | 61.06% | 63.90% | 65.49% |
* The Common App defines First-Generation as students whose parents have not received a bachelor’s or higher academic degree.
Students Who Have Children
Presumably cis women and men students are more likely to have children than trans women and men, nonbinary, and nonbinary women/men students.
| Have children? | Presumably Cis Women | Presumably Cis Men | Trans Women | Trans Men | Nonbinary | Nonbinary Women/Men |
|---|---|---|---|---|---|---|
| Yes | 0.64% | 0.66% | 0.41% | 0.47% | 0.39% | 0.41% |
Parental Structure*
Trans women and men and nonbinary students are more likely to have two mothers than presumably cis women and men students. Trans women students are more likely to have two fathers, while presumably cis women students are less likely.
| Family structure | Presumably Cis Women | Presumably Cis Men | Trans Women | Trans Men | Nonbinary | Nonbinary Women/Men |
|---|---|---|---|---|---|---|
| Mother – Father | 86.54% | 89.96% | 86.08% | 83.39% | 84.23% | 85.40% |
| Mother – Mother | 0.27% | 0.39% | 0.65% | 0.50% | 0.74% | 0.51% |
| Father – Father | 0.08% | 0.15% | 0.35% | 0.13% | 0.14% | 0.11% |
| Single Mother | 6.14% | 4.54% | 5.17% | 5.94% | 5.93% | 5.19% |
| Single Father | 0.51% | 0.48% | 0.47% | 0.79% | 0.50% | 0.60% |
* Not showing “I have limited information on this parent” responses.
Parents’ Marital Status
Presumably cis women and men students are more likely to have parents who are married than trans students, especially trans men students.
| Parents’ status | Presumably Cis Women | Presumably Cis Men | Trans Women | Trans Men | Nonbinary | Nonbinary Women/Men |
|---|---|---|---|---|---|---|
| Married | 64.06% | 70.17% | 60.48% | 52.94% | 57.90% | 58.13% |
| Divorced | 16.13% | 14.60% | 22.72% | 26.22% | 21.66% | 21.55% |
| Never Married | 10.42% | 7.41% | 8.34% | 10.80% | 11.01% | 10.70% |
| Separated | 6.88% | 5.57% | 6.17% | 6.81% | 6.55% | 6.22% |
| Widowed | 2.25% | 2.01% | 1.88% | 2.97% | 2.53% | 3.02% |
| Civil Union/ Domestic Partner | 0.27% | 0.23% | 0.41% | 0.26% | 0.35% | 0.37% |
U.S. Regions
Regions Where Students Reside*
| Region | Presumably Cis Women | Presumably Cis Men | Trans Women | Trans Men | Nonbinary | Nonbinary Women/Men |
|---|---|---|---|---|---|---|
| Northeast | 32.10% | 33.40% | 29.13% | 31.20% | 30.94% | 29.21% |
| Southeast | 24.34% | 23.57% | 24.54% | 23.08% | 22.50% | 22.87% |
| Midwest | 19.79% | 19.77% | 20.20% | 21.42% | 19.70% | 20.31% |
| Southwest | 7.57% | 7.28% | 7.75% | 7.60% | 6.80% | 8.20% |
| West | 15.75% | 15.55% | 17.73% | 16.25% | 19.61% | 18.84% |
* Not showing the percentages from D.C. and the U.S. territories.
- Northeast: CT, DE, MA, ME, MD, NH, NJ, NY, PA, RI, VT
- Southeast: AL, AR, FL, GA, KY, LA, MS, NC, SC, TN, VA, WV
- Midwest: IA, IL, IN, KS, MI, MN, MO, ND, NE, OH, SD, WI
- Southwest: AZ, NM, OK, TX
- West: AK, CA, CO, HI, ID, MT, NV, OR, UT, WA, WY
Level of Trans-Supportiveness in the States Where Students Reside
(Based on Trans Youth Access to Gender-Affirming Health Care as of Fall 2023)
Trans students are not less likely to reside in states that are hostile toward trans people or more likely to reside in trans-supportive states.
| Region | Presumably Cis Women | Presumably Cis Men | Trans Women | Trans Men | Nonbinary | Nonbinary Women/Men |
|---|---|---|---|---|---|---|
| “Hate States” | 30.11% | 29.04% | 31.06% | 29.97% | 27.38% | 28.85% |
| “Supportive States” | 47.35% | 48.62% | 46.56% | 46.50% | 49.95% | 48.73% |
| Neutral | 22.54% | 22.35% | 22.37% | 23.53% | 22.67% | 22.43% |
- “Hate States” (have a law banning access to gender-affirming care): 21 states (AL, AR, FL, GA, IA, ID, IN, KY, LA, MO, MS, MT, NC, ND, NE, OK, SD, TN, TX, UT, and WV)
- “Supportive States” (have a shield law protecting access to gender-affirming care): 14 states (AZ, CA, CO, CT, IL, MA, MD, MN, NJ, NM, NY, OR, VT, and WA) and DC
- Neutral (have neither a law limiting access or a shield law): 15 states (AK, DE, HI, KS, ME, MI, NH, NV, OH, PA, RI, SC, VA, WI, and WY) and all the U.S. territories (AS, GU, MP, PR, and VI)
Pronouns
Of the students who indicated their pronouns (n = 1,118,380), 42,731 or 3.82% used pronouns beyond just “she/her” or “he/him.” It was 3.24% in 2022.
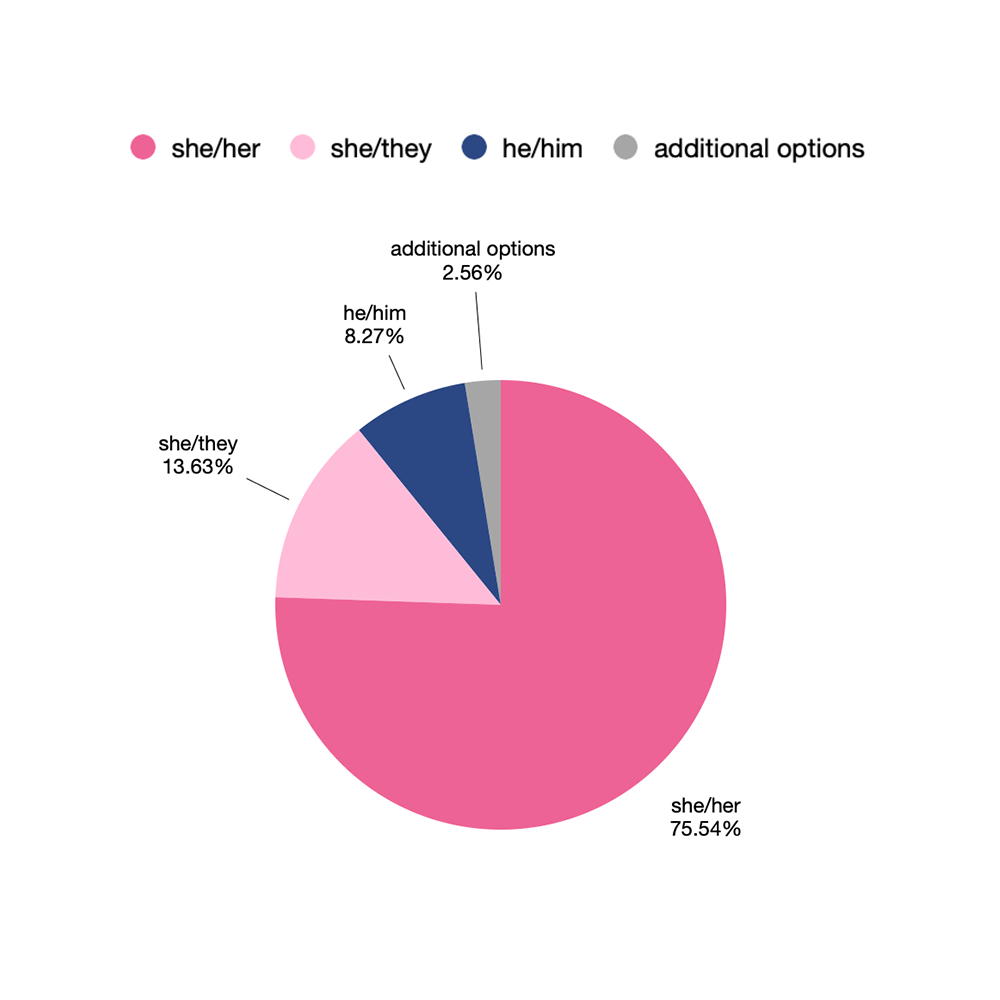
Pronouns by Gender Identity
More presumably cis women used pronouns other than just “she/her” than presumably cis men used pronouns other than just “he/him” (2.11% vs. 0.83%). The trans women were also more likely to use pronouns beyond “she/her” than the trans men were to use pronouns beyond “he/him” (24.46% vs. 19.33%). This is because a greater percentage of trans women continued to go by “he/him” than trans men continued to go by “she/her” (8.27% vs. 4.22). The difference was even greater in 2022 (21.72% vs. 6.21%). Because of transmisogyny, fewer of the trans women may be out and have begun to transition.
Pronoun Responses Among Trans Women and Men Students*
Trans Women (n=1,680)
Trans Men (n=3,772)
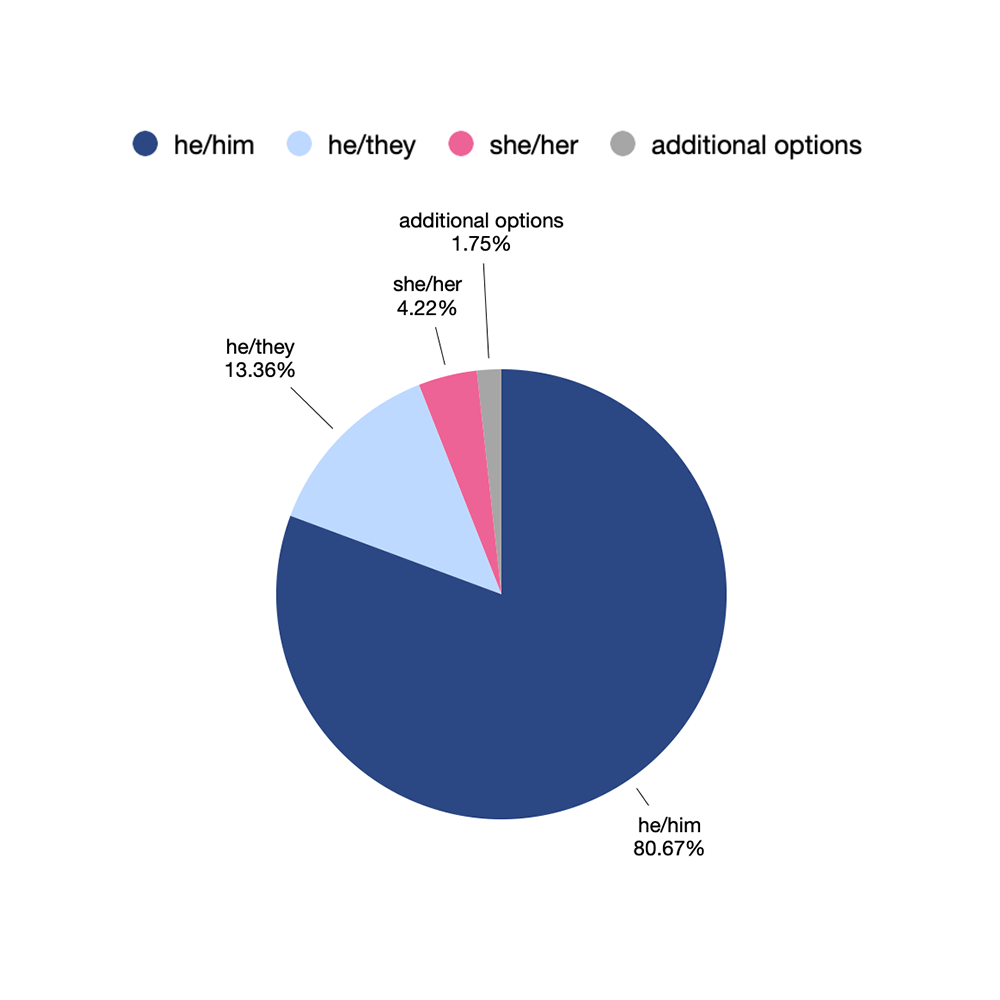
* These figures were adjusted to remove nonresponses.
Pronoun Responses Among Nonbinary and Nonbinary Women/Men Students*
More than three-fourths of nonbinary and nonbinary women/men students indicated being legally female, but nonbinary students were far more likely to go by just “they/them” than the nonbinary women/men students (45.22% vs. 3.65%). The majority (55.71%) of nonbinary women/men went by “she/they,” whereas only 16% of the nonbinary students did so. Many of the nonbinary women students used “she/her” as one of their pronoun sets seemingly because they continued to identify at different times and/or in different settings as partly female.
Nonbinary (n=19,535)
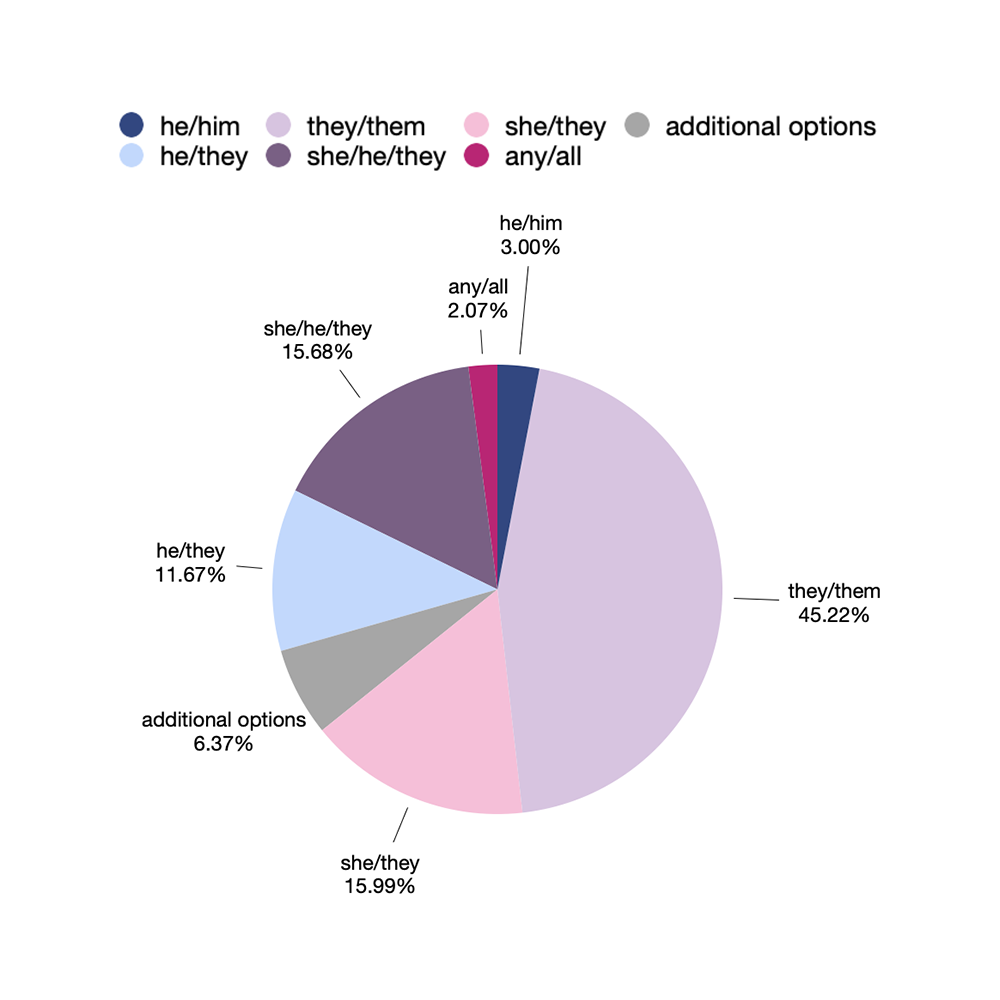
Nonbinary Women/Men (n=6,282)
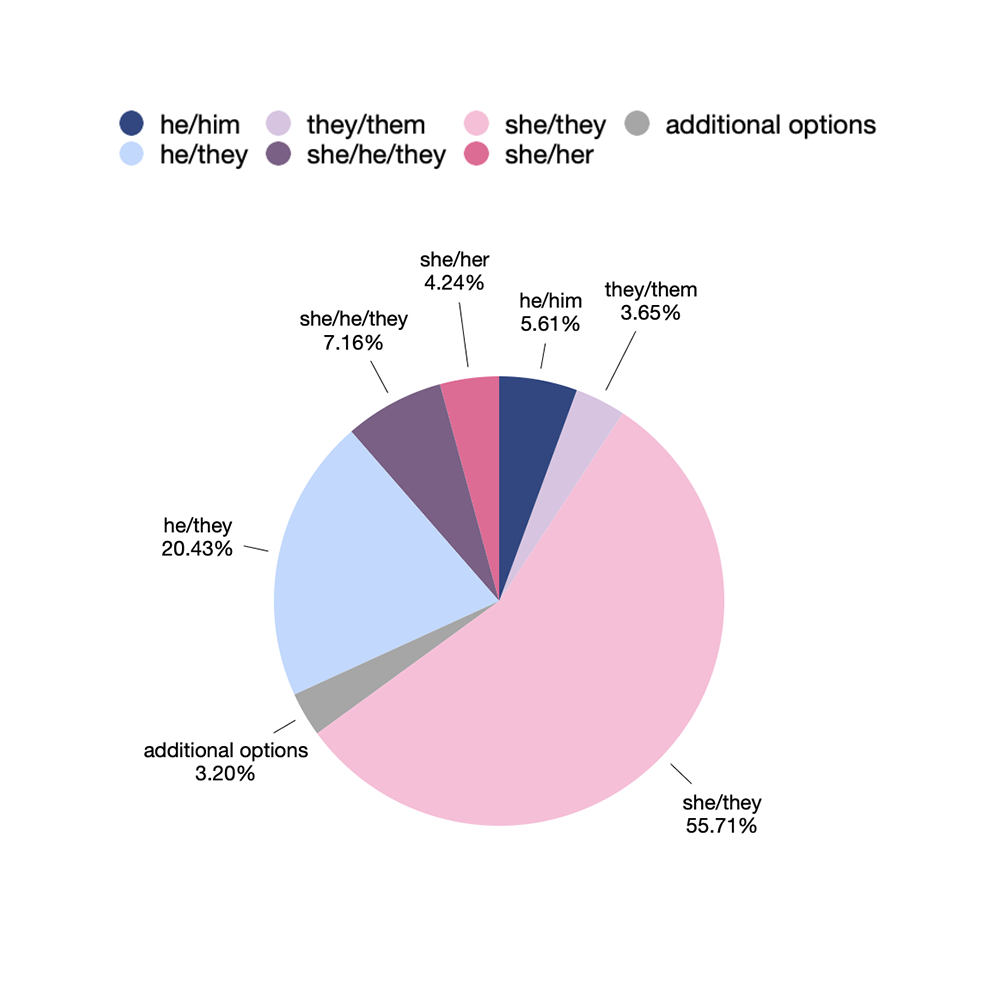
* These figures were adjusted to remove inappropriate responses and nonresponses.
Pronouns by Race
Pronouns Given by Trans Women Students of Different Races (%)
Black trans women were less likely to go by “she/her” and more likely to go by “he/him” than trans women of other races, which seemingly indicates that fewer are out as themselves and begun to transition. Given the high level of violence against Black trans women, this is not surprising.
| Pronouns | All* (1,662) | Asian American (92) | Black (154) | Latinx (256) | Two+ Races (101) | White (1,046) |
|---|---|---|---|---|---|---|
| She/her | 75.63% | 77.17% | 64.29% | 74.22% | 72.28% | 77.72% |
| She/they | 13.72% | 10.87% | 9.74% | 13.28% | 23.76% | 13.86% |
| He/him | 8.12% | 8.70% | 24.03% | 9.38% | 3.96% | 5.74% |
| He/she | 0.72% | 1.09% | 0.65% | 0.78% | — | 0.76% |
| She/he/they | 0.66% | — | 0.65% | 1.17% | — | 0.67% |
| They/them | 0.60% | — | — | 0.78% | — | 0.76% |
| Any or all | 0.06% | 1.09% | — | — | — | — |
| Other pronouns | 0.48% | 1.09% | 0.65% | 0.39% | — | 0.48% |
* This figure includes the small number of American Indian students (n = 4), Native Hawaiian or Other Pacific Islander students (n = 3), and international students (n = 6). It does not include trans women students who did not indicate their race (n = 18), pronouns (n = 18), or both (n = 5).
Pronouns Given by Trans Men Students of Different Races and by International Students (%)
Like Black trans women, Black trans men were less likely to use the pronouns commonly associated with their gender identity than trans men of other racial groups but not to the same degree.
| Pronouns | All* (3,725) | Am Indian (12) | Asian American (212) | Black (284) | Latinx (648) | Two+ Races (279) | White (2,274) | Intern’l# (14) |
|---|---|---|---|---|---|---|---|---|
| He/him | 80.51% | 75.0% | 77.83% | 72.89% | 80.25% | 78.85% | 81.97% | 92.86% |
| He/they | 13.48% | 8.33% | 10.85% | 12.32% | 11.27% | 15.77% | 14.29% | 7.14% |
| She/her | 4.24% | 8.33% | 8.02% | 13.03% | 5.56% | 3.23% | 2.51% | — |
| He/she | 0.46% | — | 0.47% | — | 1.23% | 0.36% | 0.31% | — |
| She/ he/ they | 0.16% | — | 0.47% | 0.70% | 0.31% | — | 0.04% | — |
| They/them | 0.13% | — | 0.94% | — | 0.31% | — | 0.04% | — |
| She/they | 0.11% | — | 0.94% | — | 0.15% | — | 0.04% | — |
| Name only | 0.03% | 8.33% | — | — | — | — | — | — |
| Other pronouns | 0.89% | — | 0.47% | 1.06% | 0.93% | 1.79% | 0.79% | — |
* This figure includes the small number of Native Hawaiian or Other Pacific Islander students (n = 2). It does not include trans men students who did not indicate their race (n = 47), pronouns (n = 25), or both (n = 9).
# International
Pronouns Given by Nonbinary Students of Different Races and by International Students (%)
Nonbinary students of all races most commonly used “they/them.” Reflecting the disproportionate percent of binary students who were legally female, the second most common pronouns for most racial groups was “she/her” and “they/them.”
| Pronouns | All* (19,249) | Am Indian (53) | Asian Am. (1,445) | Black (1,845) | Latinx (3,872) | Hawaiian or Other PI (15) | Two+ Races (1,431) | White (10,498) | Intern’l# (88) |
|---|---|---|---|---|---|---|---|---|---|
| They/them | 45.25% | 37.74% | 40.76% | 39.13% | 42.17% | 53.33% | 40.95% | 48.80% | 34.09% |
| She/they | 16.03% | 20.75% | 15.99% | 18.59% | 17.20% | 13.33% | 15.51% | 15.21% | 15.91% |
| She/he/they | 15.72% | 15.09% | 18.69% | 15.18% | 18.13% | 6.67% | 19.36% | 14.03% | 15.91% |
| He/they | 11.60% | 5.66% | 10.73% | 11.00% | 11.05% | 13.33% | 12.65% | 11.89% | 14.77% |
| He/him | 2.97% | 9.43% | 3.39% | 4.72% | 2.89% | — | 2.66% | 2.58% | 10.23% |
| Any or all | 2.05% | 1.89% | 3.25% | 1.68% | 2.25% | — | 1.89% | 1.91% | 1.14% |
| She/her | 1.89% | 1.89% | 2.08% | 4.99% | 2.07% | 6.67% | 1.33% | 1.31% | 4.55% |
| He/She | 1.83% | — | 2.56% | 2.11% | 2.07% | — | 2.38% | 1.52% | 2.27% |
| Neopronouns | 0.10% | 1.89% | 0.07% | 0.16% | 0.08% | — | 0.14% | 0.10% | — |
| It/its | 0.05% | — | 0.07% | 0.11% | 0.05% | — | 0.07% | 0.03% | — |
| No pronouns | 0.04% | 1.89% | — | 0.16% | 0.08% | — | — | — | 1.14% |
| Other pronouns | 2.46% | 3.77% | 2.42% | 2.17% | 1.97% | 6.67% | 3.07% | 2.62% | — |
* This figure does not include nonbinary students who did not indicate their race (n = 288), pronouns (n = 121), or both (n = 19) and three inappropriate response.
# International
Pronouns Given by Nonbinary Women/Men Students of Different Races and by International Students (%)
| Pronouns | All* (6,162) | Am Indian (22) | Asian Am. (540) | Black (652) | Latinx (1,221) | Two+ Races (575) | White (3,124) | Intern’l# (24) |
|---|---|---|---|---|---|---|---|---|
| She/they | 55.89% | 54.55% | 52.41% | 56.90% | 55.36% | 56.70% | 56.37% | 41.67% |
| He/they | 20.33% | 18.18% | 17.96% | 14.72% | 21.54% | 17.74% | 21.99% | 12.50% |
| She/he/they | 7.16% | 4.55% | 8.15% | 9.05% | 7.37% | 9.04% | 6.21% | 4.17% |
| He/him | 5.53% | 9.09% | 7.59% | 5.67% | 4.42% | 6.43% | 5.38% | 4.17% |
| She/her | 4.24% | 13.64% | 6.67% | 6.60% | 3.52% | 2.96% | 3.55% | 29.17% |
| They/them | 3.62% | — | 3.70% | 3.53% | 4.91% | 3.30% | 3.20% | 4.17% |
| Any or all | 1.04% | — | 1.67% | 1.07% | 1.06% | 0.70% | 0.99% | — |
| He/she | 0.70% | — | 1.11% | 1.07% | 0.25% | 1.22% | 0.64% | — |
| Neopronouns | 0.03% | — | — | — | — | — | 0.06% | — |
| No pronouns | 0.03% | — | 0.19% | — | — | — | 0.03% | — |
| Other pronouns | 1.49% | — | 0.56% | 1.38% | 1.56% | 1.91% | 1.57% | 4.17% |
* This figure includes the small number of Native Hawaiian or Other Pacific Islander students (n = 8). It does not include nonbinary women/men students who did not indicate their race (n = 92), pronouns (n = 24), or both (n = 4).
# International
Racial and Class Limits of the Common App
968 of the 1,029 Common App colleges in 2023 have IPEDS data. Of these 968:
- 29 are Historically Black Colleges and Universities (there are 107 HBCUs).
- 7 are Predominantly Black Institutions (institutions where at least 40% of undergrads are Black; there more than 60 PBIs).
- 76 are Hispanic-Serving Institutions (institutions where at least 25% Latinx students; there are more than 500 HSIs).
- None are Tribal College and Universities (there are 32 TCUs).
- 3 are Native American-Serving Nontribal Institutions (institutions where at least 10% Native American students; there are about 30 NASNTIs).
- 4 are Alaskan Native- or Native Hawaiian-Serving Institutions (institutions where at least 20% Alaska Native or at least 10% Native Hawaiian students; there are about 15 ANNHs).
- 32 are Asian American and Native American Pacific Islander-Serving Institutions (institutions where at least 10% Asian American and Native American Pacific Islander students; there are more than 200 AANAPISIs).
- Only one is a community college (there are more than 1,000 community colleges).